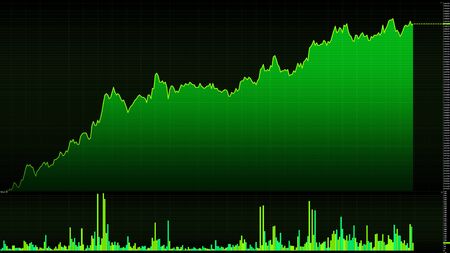
Last seen in April 2013, Bitcoin has closed on a clean bullish move. In that year, it closed at $140 and retraced to less than $100. Then it moved 700% up for the next six months.
In 2017, a similar move was seen. Although it was a five candle move. The price moved from roughly $5,000 to $20,000 that year. What does this mean? If this history reoccurs, Bloomberg prediction of $400,000 may be very practical.

Traders like Peter Brandt, have predicted a bullish move of over 250% of the current Bitcoin price. Which will take the price of Bitcoin to over $200,000.
Although all these moves have been successful, it is worth noting that it is not a guarantee that the price will move. Looking back in early 2016 when there was a crash of 20% even after a successful five green candles in the late weeks of 2015. A similar trend is noticed in 2019 when the prices were bullish for 5 months consecutively and then a 60% loss followed in March 2020.