What is Moving Average ?
Moving Average : Boosting Crypto Trading with Trends – Cryptocurrency trading has witnessed a remarkable surge in popularity in recent years, driven by the growing adoption and mainstream recognition of digital assets. As traders delve into this dynamic market, they rely on various tools and techniques to analyze price movements and make informed trading decisions. One such powerful tool is technical analysis, which involves studying historical price data to predict future price movements. Within the realm of technical analysis, moving averages play a crucial role as a popular and widely used technical indicator.
Explanation of the increasing popularity of cryptocurrency trading
The rise of cryptocurrencies, led by Bitcoin, has revolutionized the financial landscape, offering individuals a decentralized and potentially lucrative investment opportunity. The promise of substantial returns and the disruptive nature of blockchain technology have attracted a large number of traders and investors to the world of cryptocurrencies. With crypto exchanges and trading platforms readily accessible like Huobi, people from all walks of life have been enticed by the potential profits that can be generated by participating in this market.
Introduction to technical analysis and its relevance in crypto trading
Technical analysis is a methodology employed by traders to forecast future price movements by analyzing historical price patterns, trading volume, and other market data. It is based on the belief that historical price movements and patterns tend to repeat themselves, providing insights into future market behavior. In the realm of crypto trading, technical analysis has gained significant traction as traders seek to identify trends, determine entry and exit points, and manage their risk effectively.
Importance of moving averages as a popular technical indicator
Among the array of technical indicators, moving averages hold a prominent position in the toolkit of crypto traders. A moving average is a calculation that smoothes out price data by averaging the closing prices over a specified period. It helps traders filter out short-term price fluctuations and uncover the underlying trends within a given time frame. By offering a clearer view of market direction, moving averages assist traders in making more informed trading decisions.
In the following sections, we will delve deeper into the concept of moving averages, exploring different types and their applications in crypto trading and crypto signals. We will discuss how moving averages aid in identifying trends, determining support and resistance levels, and generating buy or sell signals. Additionally, we will highlight important considerations and limitations associated with moving averages, underscoring the need for a comprehensive moving average trading strategy that incorporates risk management techniques.
So let’s explore the fascinating world of moving averages and discover how they can empower crypto traders to navigate the volatile cryptocurrency markets more effectively.
Moving averages are a fundamental tool in technical analysis used to analyze price trends and smooth out short-term fluctuations in financial markets, including cryptocurrency markets. This is calculated by averaging the prices of an asset over a specified time period, providing traders with a clearer view of the overall trend.
The primary purpose of using moving averages is to identify and confirm the direction of price movements. By filtering out noise and focusing on the average of price action over a given period, moving averages enable traders to better understand the underlying market sentiment and make informed trading decisions.
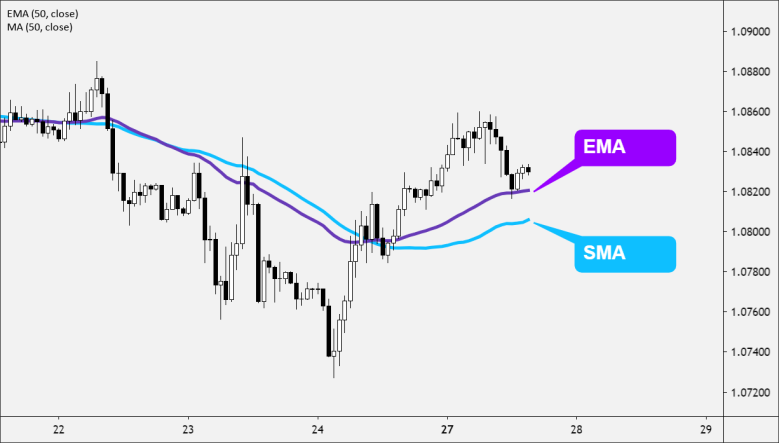
Calculation methods: Simple Moving Average (SMA) and Exponential Moving Average (EMA)
There are different calculation methods for this indicator, with the two most commonly used being the Simple Moving Average (SMA) and the Exponential Moving Average (EMA).
- Simple Moving Average (SMA): The SMA is the most straightforward moving average calculation. It is determined by summing up the closing prices of an asset over a specified period and then dividing the sum by the number of periods. For example, a 20-day SMA would consider the closing prices of the last 20 trading days.
The SMA treats each historical data point equally, assigning equal weight to all prices within the chosen period. This calculation method is suitable for traders who prefer a smoother and more stable average that is less responsive to recent price changes.
- Exponential Moving Average (EMA): The EMA is a more dynamic indicator calculation that places greater weight on recent price data. Unlike the SMA, which assigns equal weight to all periods, the EMA assigns more weight to the most recent prices, making it more responsive to current market conditions.
The EMA calculation involves assigning a weightage multiplier to each data point. The multiplier is determined by a formula that incorporates the desired period and a smoothing factor. As a result, the EMA reacts more quickly to price changes, making it a popular choice for traders who seek to capture short-term trends.
Explanation of the smoothing effect and its benefits
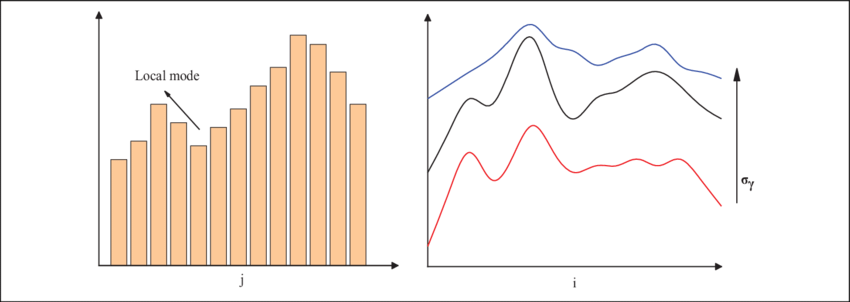
One of the key advantages of using moving averages is the smoothing effect they provide. By averaging out price fluctuations over a specific time frame, moving averages help traders filter out noise and identify the underlying trend more accurately.
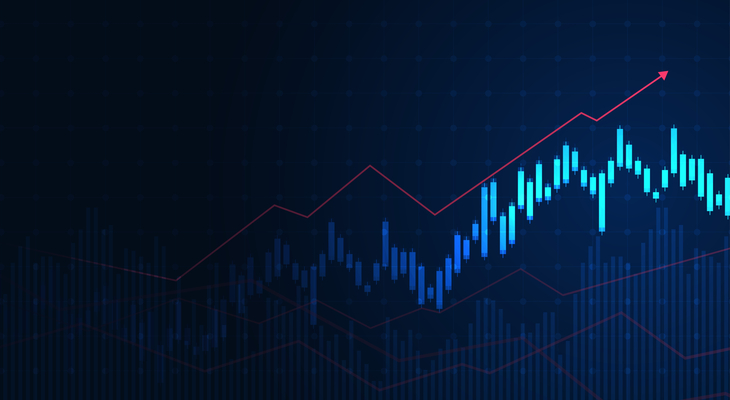
The smoothing effect helps traders visualize the overall direction of an asset’s price movement, making it easier to identify bullish (upward) or bearish (downward) trends. This aids in identifying potential entry and exit points, as traders can look for buying opportunities when the price is at triangular indicator or above the moving average in an uptrend or selling opportunities when the price is below the moving average in a downtrend.
Moreover, moving averages also act as support or resistance levels, providing traders with additional insights. In an uptrend, the moving average can serve as a support level, indicating potential buying opportunities when the price retraces and touches the moving average. Conversely, in a downtrend, the moving average can act as a resistance level, signaling potential selling opportunities when the price approaches the moving average.
In the next section, we will explore different types of moving averages, their specific characteristics, and how they are utilized in cryptocurrency trading strategies.
II. Types of Moving Averages

Simple Moving Average (SMA): Calculation and interpretation
The Simple Moving Average (SMA) is one of the most commonly used types of moving averages. It is calculated by adding up the closing prices of an asset over a specified period and then dividing the sum by the number of periods. For example, a 20-day SMA would consider the closing prices of the last 20 trading days.
The SMA assigns equal weight to each data point within the chosen period, resulting in a smooth average line that follows the general price trend. Traders often use the SMA to identify key support and levels of resistance, as well as to determine the overall trend direction. When the price crosses above the SMA, it may signal a bullish trend, while a cross below the SMA may indicate a bearish trend.
Exponential Moving Average (EMA): Calculation and advantages over SMA
The Exponential Moving Average (EMA) is another popular type of indicator that gives more weight to recent price data. Unlike the SMA, which treats closing price for each period equally, the EMA assigns greater importance to the most recent prices.
To calculate the EMA, traders start with a chosen period and a smoothing factor. The initial EMA value is usually taken as the SMA of the first period. Then, for the average trading price chart each subsequent period, the EMA is calculated using the formula:
EMA = (Current price – EMA(previous period)) * (Smoothing factor) + EMA(previous period)
The smoothing factor determines the weight assigned to the current price, and it is typically derived from shorter moving average crosses the chosen period. As a result, the EMA responds more quickly to recent price changes compared to the SMA.
Traders often and traders prefer to using the EMA over the SMA because it provides a more timely reflection of market conditions. The EMA is especially useful for short-term trading strategies where capturing current trends is crucial. Crossovers between different EMA periods are commonly used as trading signals. For example, when a shorter EMA crosses above a longer EMA, it may indicate a bullish signal, while a crossover to the downside may suggest a bearish signal.
Other variations: Weighted Moving Average (WMA) and Smoothed Moving Average (SMMA)
In addition to SMA and EMA, there are other variations of moving averages that traders may use based on their preferences and trading strategies.
- Weighted Moving Average (WMA): The Weighted Moving Average assigns different weights to each data point within the chosen period. The weights can be linear or exponential, giving more importance to recent prices. WMAs offer a balance between SMAs and EMAs, providing smoother lines while still being responsive to recent price changes.
- Smoothed Moving Average (SMMA): The Smoothed indicator is similar to the EMA but provides even more emphasis on recent prices. SMMA uses a more complex calculation formula that applies a smoothing factor to the previous SMMA value and the current price.
Traders may experiment with different types of moving averages to find the one that aligns best with their trading style and market conditions. The choice of moving average type depends on the desired level of responsiveness, the trading time frame, and the specific trading strategy employed.
In the next section, we will explore how moving averages aid crypto traders in identifying trends, determining support and levels of resistance, and generating trading signals for their strategies.
III. How Moving Averages Aid Crypto Trading

Identifying trends: Using moving averages to determine the general direction of an asset’s price movement
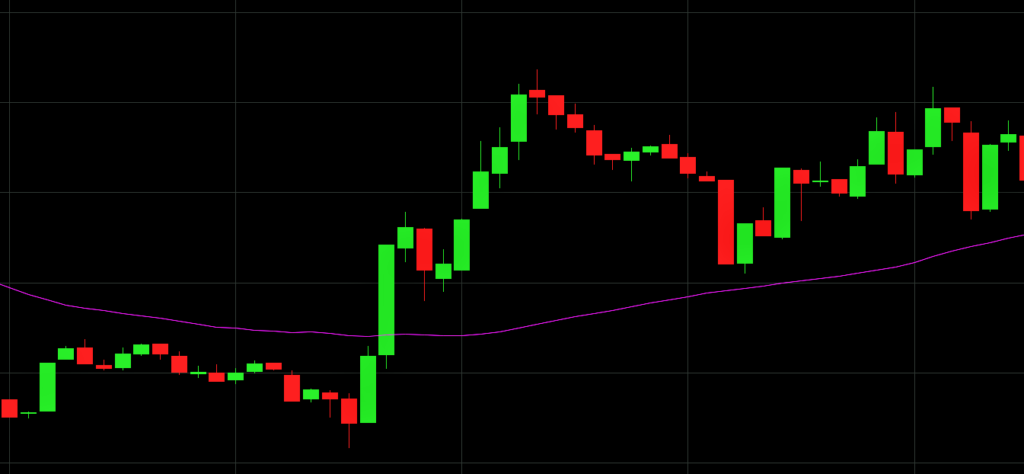
Moving averages play a vital role in helping crypto traders identify trends in the market. By smoothing out short-term price fluctuations, moving average provide a clearer picture of the overall direction of an asset’s price movement. Traders commonly use moving average of different periods to identify different trend durations.
For example, a long-term moving average, such as a 200-day SMA, can help determine the overall long-term trend. If the price is consistently above the 200-day SMA, it indicates a bullish trend, while a price below the 200-day SMA suggests a bearish trend. Shorter-term moving averages, like a 50-day or 20-day SMA, can provide insights into intermediate or short-term trends.
Support and levels of resistance: Role of moving averages in determining key levels of support and resistance
Moving average also serve as dynamic support and resistance levels in crypto trading. When the price approaches a moving average from below, the indicator may act as a support level, potentially halting or slowing down price declines. Conversely, when the price approaches a moving average from above, it may serve as a resistance level, impeding further upward movement.
Traders often monitor the interaction between price and moving average to identify potential entry and exit points. If the price bounces off a moving average and continues to move in the direction of the trend, it can be seen as a confirmation of the support or resistance level. These levels can guide traders in setting stop-loss orders, determining profit targets, or initiating trades based on the expectation of price reactions at these levels.
Golden cross and death cross: Significance of the crossover between different moving averages
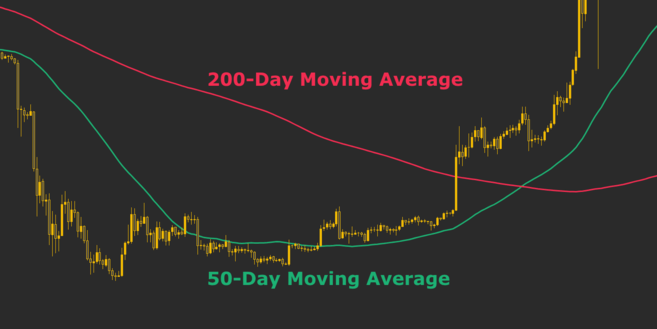
The crossover between different moving averages holds significant importance in technical analysis and is often used as a trading signal. Two commonly watched moving averages for crossovers are the 50-day and 200-day SMAs. When the shorter-term moving average, such as the 50-day SMA, crosses above the longer-term moving average, like the 200-day SMA, it is known as a “golden cross.”
A golden cross is considered a bullish signal, indicating a potential upward trend and potentially attracting more buyers. Conversely, when the shorter-term moving average crosses below the longer-term moving average, it is called a “death cross.” A death cross is seen as a bearish signal, suggesting a potential downward trend and possibly prompting selling pressure.
Traders often combine the analysis of crossovers with other technical indicators or confirmatory signals to strengthen their trading decisions. The significance of these crossovers can vary depending on the market conditions, timeframes, and the specific assets being traded.
By utilizing moving averages, traders can gain valuable insights into the general trend direction, identify potential support and levels of resistance, and leverage crossover signals to aid in their decision-making process.
In the next section, we will explore practical applications of moving averages in crypto trading, including determining entry and exit points, utilizing multiple moving averages, and considering the limitations and considerations associated with their usage.
IV. Practical Application of Moving Averages in Crypto Trading

Determining entry and exit points: Using moving average to time buy and sell signals
Moving averages are widely used by crypto traders to determine optimal entry and exit points for their trades. When the price crosses above a moving average, it may signal a potential buying opportunity, indicating that the trend is turning bullish. Conversely, when the price crosses below a moving average, it may suggest a selling opportunity, indicating a potential bearish trend.
Traders often combine simple moving averages on average of different periods to generate more reliable buy and sell signals. For example, a trader may wait for the price to cross above both the 50-day SMA and the 200-day SMA before initiating a buy order. This crossover of two moving averages can provide a stronger confirmation of a bullish trend. Similarly, a sell signal could be triggered by the price crossing below both moving averages.
Multiple moving averages: Combining different periods to generate stronger trading signals
Utilizing multiple moving averages of different periods can enhance the effectiveness of trading signals. By combining shorter-term and longer-term moving averages, traders can gain a broader perspective on the market, identify trend direction and reduce the risk of false signals.
For instance, a trader might use a combination of a 10-day SMA, a 50-day SMA, and a 200-day SMA. When the 10-day SMA crosses above the 50-day SMA and the 50-day SMA is above the 200-day SMA, it can serve as a strong bullish signal. This alignment of moving averages confirms the short-term trend’s strength within the context of the longer-term trend.
The choice of moving average periods depends on the trader’s trading style, timeframe, and the specific cryptocurrency being traded. Experimentation and backtesting different combinations of moving averages can help traders find the most suitable setup for their trading strategies.
Avoiding false signals: Confirming moving average signals with other technical indicators
While moving averages are valuable tools, they can sometimes generate false signals, especially in choppy or sideways markets. To avoid falling victim to false signals, traders often incorporate additional technical indicators to confirm the validity of moving average signals.
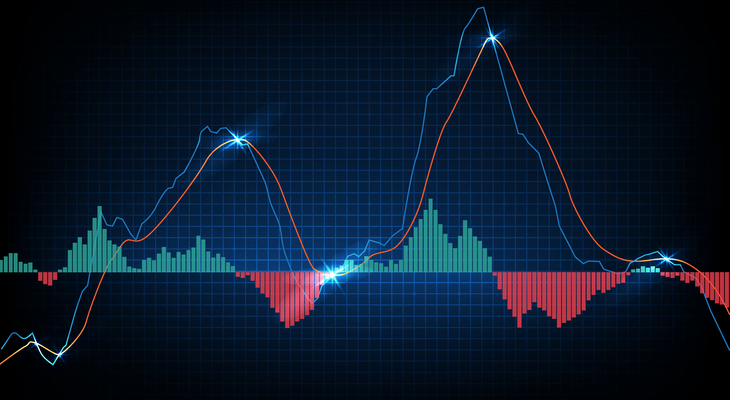
Popular technical indicators that complement moving averages include oscillators like the Relative Strength Index (RSI), the Moving Average Convergence Divergence (MACD), or the Stochastic Oscillator. These indicators can provide insights into overbought or oversold conditions, divergence patterns, or momentum shifts, helping traders validate or reject moving average signals.
By combining multiple indicators, traders can increase the reliability of their trading decisions and reduce the likelihood of entering or exiting trades based solely on moving average price signals.
It is important to note that while moving averages are powerful tools, they are not foolproof. They work best in trending markets and may generate false signals in volatile or range-bound markets. Therefore, traders should consider other aspects of technical analysis, fundamental analysis, and risk management strategies to build a comprehensive trading approach.
In the next section, we will discuss important considerations and limitations when using moving average in crypto trading, emphasizing the need for a well-rounded trading strategy.
V. Limitations and Considerations

Lagging nature of moving average and the potential for delayed signals
One limitation of moving average is their lagging nature. Moving averages are calculated based on historical price data, which means they reflect past trends rather than providing real-time information. As a result, moving average may produce delayed signals, causing traders to enter or exit positions later than desired.
Traders need to be aware of this lag slower moving average and consider it when making trading decisions. Supplementing moving averages with other indicators or techniques can help identify potential trend reversals or early entry opportunities.
Volatile market conditions: Adapting moving average strategies to suit different market environments
Moving average perform best in trending markets where prices follow a clear direction. However, in volatile or range-bound markets, moving averages may generate false signals or produce whipsaws (rapid price reversals).
Traders should be cautious when relying solely on moving averages in volatile market conditions. It is important to assess the overall market environment and consider additional indicators, such as volatility measures or pattern recognition tools, to validate moving average signals or adapt the strategy accordingly.

Importance of risk management and not relying solely on moving averages
While moving averages are valuable tools in crypto trading, it is crucial to remember that they are not foolproof predictors of market movements. Traders should not solely rely on moving average to make trading decisions but should instead adopt a comprehensive approach that includes risk management strategies and the analysis of other relevant factors.
Implementing proper risk management techniques, such as setting stop-loss orders, considering position sizing based on risk tolerance, and diversifying portfolios, and moving average trading strategies is vital to protect against potential losses. Moving averages should be used as part of a broader trading plan that takes into account the trader’s risk appetite, time horizon, and overall market analysis.
Additionally, it is recommended to stay updated with market news, fundamental developments, and regulatory changes that may impact the cryptocurrency market. By integrating fundamental analysis with technical analysis, traders can gain a more comprehensive understanding of the market and make more informed decisions.
Conclusion

Recap of the key points discussed in the article
Throughout this article, we have explored the concept of a moving average crossover system of averages and their relevance in crypto trading. We began by defining individual moving average lines or averages and understanding their purpose in analyzing price trends. We delved into the calculation methods of Simple Moving Average (SMA) and Exponential Moving Average (EMA), discussing their respective characteristics and benefits. Also touched upon other variations such as Weighted Moving Average (WMA) and Smoothed Moving Average (SMMA).
We then moved on to discuss the practical applications of moving averages in crypto trading. When we explored how moving average aid traders in identifying trends, determining support and resistance levels, and utilizing crossover signals such as the golden cross and death cross. We also highlighted the importance of combining different periods of the moving average crossover with two exponential moving averages, to generate stronger trading signals and avoiding false signals by confirming with other technical indicators.
Emphasizing the significance of moving averages in crypto trading
Moving average hold significant importance in crypto trading due to their ability to provide insights into market trends, support and resistance levels, and potential entry and exit points. They serve as valuable tools for traders to make informed decisions and navigate the dynamic cryptocurrency markets.
Encouraging traders to explore different variations and combinations of moving averages for improved trading strategies
Traders are encouraged to explore different variations and combinations of moving averages based on their trading style, timeframe, and the specific cryptocurrencies they trade. By experimenting with various types of moving averages, traders can find the most suitable setups that align with their trading strategies and market conditions. Additionally, incorporating other technical indicators and considering risk management practices will contribute to a well-rounded trading approach.
In conclusion, moving average indicators offer valuable insights and signals for crypto traders. While they have limitations, such as lagging nature and challenges in volatile markets, they remain powerful tools when used in conjunction with other indicators and a comprehensive trading strategy. By understanding the strengths and limitations of the moving average strategy and averages and adapting them to suit market conditions, traders can enhance their decision-making process and increase their chances of success in the ever-evolving world of cryptocurrency trading.
This article is not investment advice. Do your own research before investing in the cryptocurrency market.