To learn how to trade, you need to know how to use the best trading indicators and Price Action Trading to do technical analysis and thus forecast the evolution of a financial market. The best known are MACD, RSI, Bollinger and Ichimoku, but there are others that are very interesting.
It is important not to rely on a single indicator but to observe several in order to have the best possible view of the market. Trading indicators are also called technical indicators. Price Action Trading is the analysis of the graph, prices and their levels.
To use the best trading indicators for your Technical Analysis and to do Price Action Trading, it is best to use TradingView which offers to display or plot them on the graph of the relevant market. The free Crypto Trading Wall Of Traders platform integrates the TradingView graph and all the best Trading indicators described in this article. This platform will let you do Price Action Trading.
In addition, this platform integrates a more powerful and complete Trading Terminal than the ones offered by exchanges such as Binance, Binance Futures, Kraken, Bitstamp, Bittrex, Bitfine. You can use Telegram Notifications, Trailings, SL, multi TP… And you are able to Copy the Best Traders in automatic.
In a future article, I will talk to you about chart figures that allow you to identify trend reversals and which are also part of Technical Analysis in Trading.
Good reading !
Chapters
Japanese Candlesticks
Resistances and Supports
Make your technical analysis for trading by plotting the best indicators and by doing Price Action Trading on the TradingView graph
Volume
RSI
Moving Averages
MACD
The Stochastic Oscillator
Ichimoku
Bollinger Bands
The Pivot Point
Price Action Trading : Waves
          Description
          Use
Price Action Trading : Elliott Waves
Japanese Candlesticks
Widely used in Technical Analysis for Trading, it is a set of candles. A candle is a graphical representation of the price change over a unit of time. This is the basis of Price Action Trading.
First of all, you have to choose a unit of time to analyze the graph, for example:
- unit H4: each candle is calculated over 4 hours.
- unit M15: each candle is calculated over 15 Minutes.
All periods are possible, for example: 1 minute, 5 minutes, 3 hours, 1 day, 1 week, 1 month, 1 quarter, 1 semester, 1 year.
We will talk about opening for the moment the period begins and closing for the moment the period ends.
A candle visually gives several information:
The color red
If the closing price is lower than the opening price
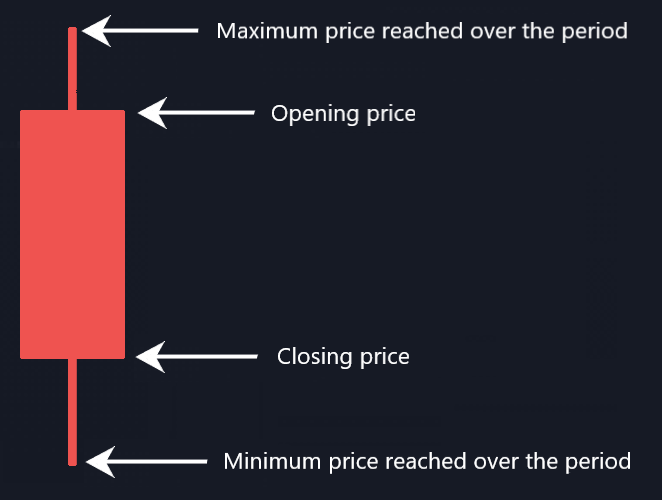
The color green
If the closing price is higher than the opening price
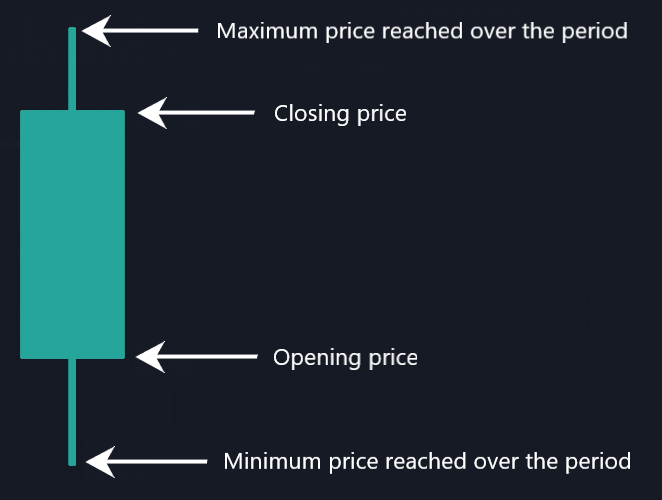
- the high wick gives the maximum price reached over the period
- the low wick gives the minimum price reached over the period
A small candle with a large wick gives an indication that the current trend is likely to be reversed. The large wick gives the indication that there has been an attempt to keep pushing the price, but as the candle is small the price has finally changed little from the last candle, so the current trend is likely to be reversed.
Conversely, a large candle in the direction of the trend (red in a downtrend, green in an uptrend) with a small wick indicates that the current trend is confirmed. This is because the price has fluctuated significantly from the last candle, and there has been no attempt to move the price the other way because the wick is short.
The interpretation of candles can be taken much further to do Price Action Trading and some traders are particularly fond of it.
Resistances and Supports
Resistances and supports are horizontal lines used very commonly in Technical Analysis to do Price Action Trading.
A resistance is a high price which has historically difficulties to be crossed by the market. It can be represented by a horizontal line above the historical maximum prices.
When the resistance is broken, which means, when one candle has crossed above resistance as well as the next candle, it is an uptrend confirmation. So it may be a good time to buy.
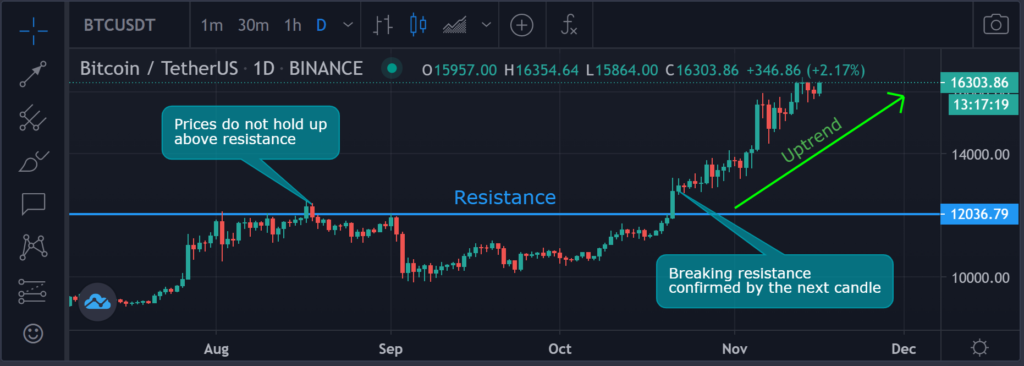
When the resistance is reversed, which means when the market price picked up the resistance price or approached it, but failed to cross it and started again in a bearish movement, it is an uptrend invalidation. So it can be a good time to sell.
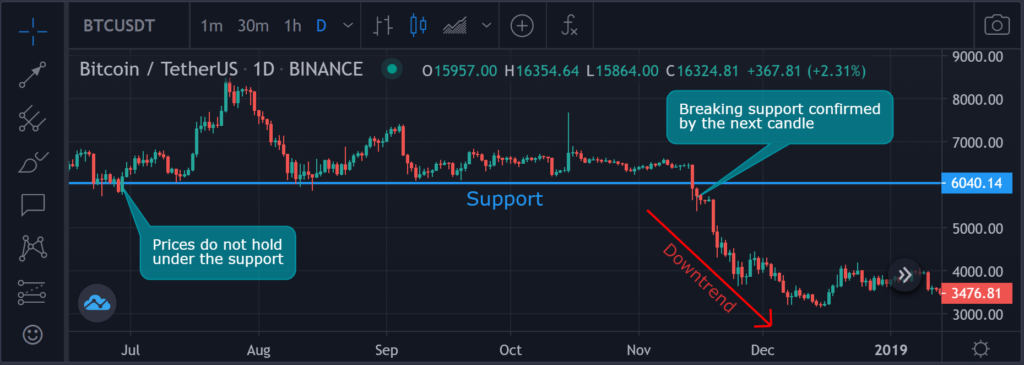
A support is a low price that has historically struggled to be breached by the market. It can be represented by a horizontal line below the historical minimum prices.
At the breakout of support, which means, when a candle has passed under support as well as the next candle, it is a downtrend confirmation. So it can be a good time to sell.
At the reversal of the support, which means when the market price picked up the price of the support or approached it, but failed to cross it and started again in a bullish movement, it is a downtrend invalidation. So it may be a good time to buy.
Resistances and Supports are therefore very useful in Price Action Trading.
Make your technical trading analysis by plotting the best indicators and by doing Price Action Trading on the TradingView graph
To use the best trading indicators, go to the Wall Of Traders Smart Trading interface.
Click on the graph and hold the click while moving sideways to navigate through time.
Use your mouse wheel to enlarge or reduce the size of the graph.
Use your mouse wheel while holding the CTRL key to zoom in on a specific area.
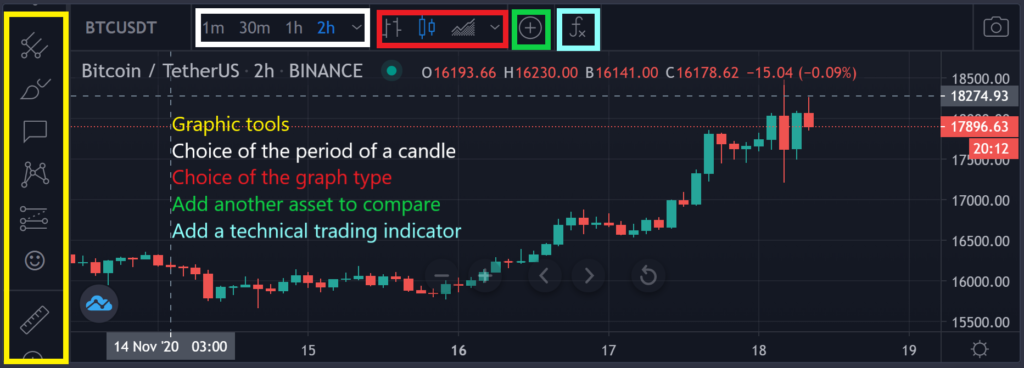
Here are the 5 useful areas in order to:
- draw
- choose your period
- choose your type of graph
- add another asset
- add a technical trading indicator
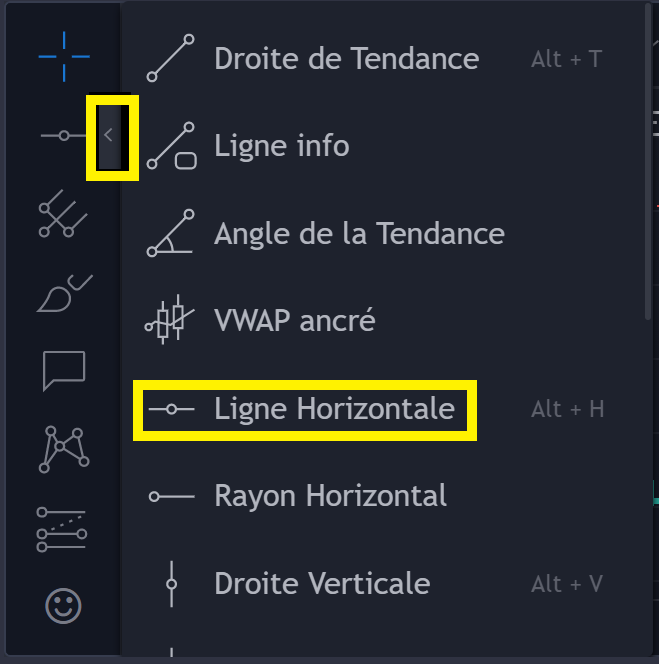
To draw a Resistance or a Support, in the Graphic Tools section, click on the small arrow just to the right of the icon then click on “Horizontal Line”. Then click on the graph:
To add a Technical Trading Indicator, click on the icon 
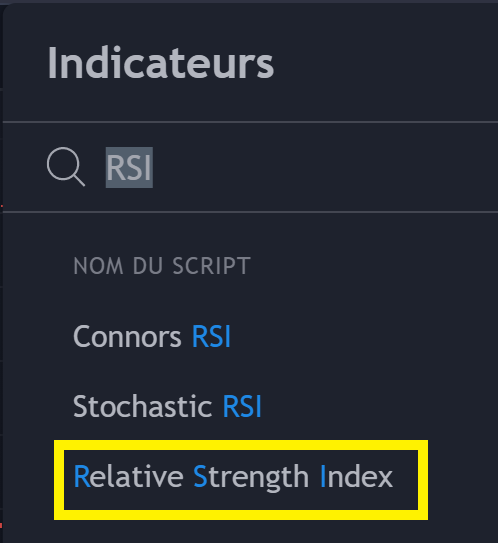
It is instantly displayed on the graph.
Volume
On a given pair, the volume is the total value of trade between the two assets in the pair.
The greater the volume at an instant t, the more powerful the current movement. A downtrend or an uptrend will tend to intensify if the volume is large over the same time period.
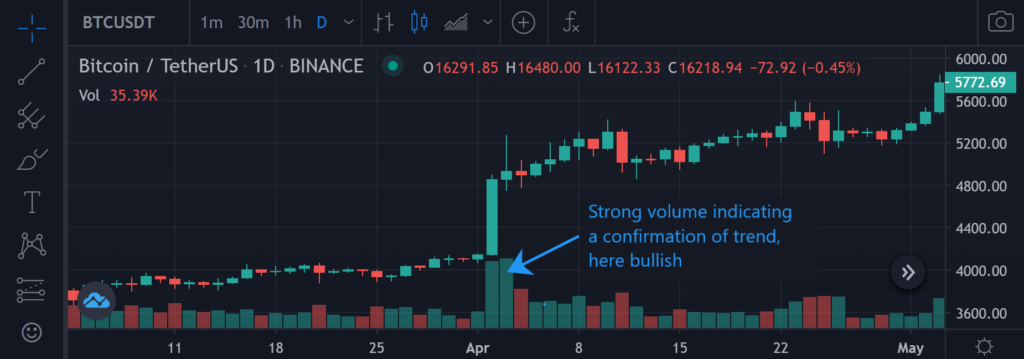
Conversely, if the volume is low you should not place too much emphasis on the current trend, unless of course other trading indicators give credibility to this trend.
When the market price is near support, a high sell volume or low buy volume portends an impending breakout of support. While low sell volume or high buy volume portends reversal of support.
When the market price is near resistance, a high buy volume or low sell volume portends an impending resistance breakout. While low buy volume or high sell volume portends reversal of resistance.
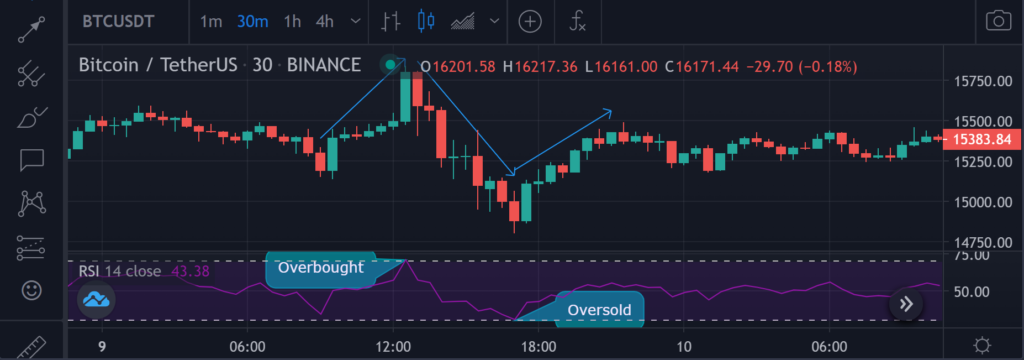
RSI
The RSI, for Relative Strength Index, gives an indication of the strength of the market trend. It is one of the best known and one of the best trading indicators.
If the RSI is above 70, then the market is overbought so the uptrend may subside.
If the RSI is below 30, then the market is oversold so the bearish movement may subside.

But RSI alone does not give a reliable indication. We must also look at the evolution of the price. If the price and the RSI move in opposite directions, this is the RSI divergence and we can expect a trend reversal.
Over a given period, if:
- the price decreases but the RSI increases, we speak of bullish divergence with a probable bullish movement to come.
- the price increases but the RSI decreases, we speak of bearish divergence with a probable downward movement to come.
Moving Averages
You know the “classic” average. It is the sum of all the values divided by the number of values.
The simple moving average (SMA), is an average recalculated at each moment by taking all the past values of a defined time interval. It gives a smooth price curve. It is one of the best indicators used in technical trading analysis.
- The shorter the time interval, the closer the SMA is to the market price.
- The longer the time interval, the smoother the SMA is relative to the market price.
- An SMA calculated on the last 20 candles will be noted SMA20.
- An SMA calculated on the last 50 candles will be noted SMA50.
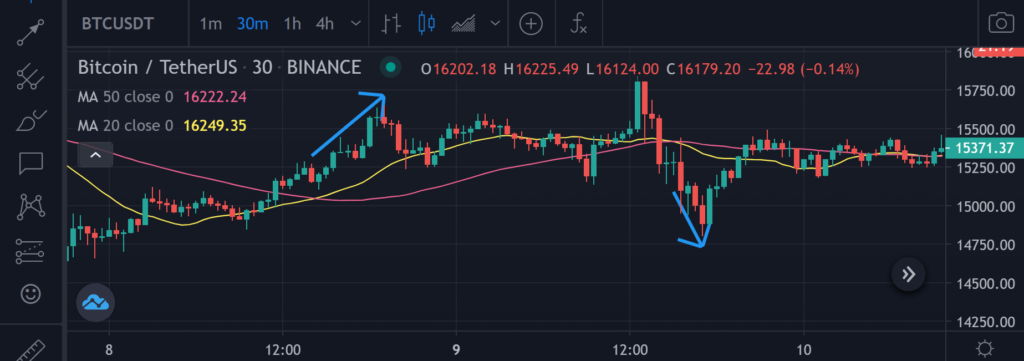
If the SMA20 curve was under the SMA50 curve, and it intersects the SMA50 to pass above, the SMA20 is said to cross the SMA50 on the upside. This is a signal for bullish movement, so a signal to buy.
If the SMA20 curve was above the SMA50 curve, and it intersects the SMA50 to go below, the SMA20 is said to cross the SMA50 on the downside. This is a signal for bearish movement, so a signal to sell.
The exponential moving average, or exponential moving average (EMA) in English, follows the same principle but it is calculated by giving more weight to the most recent candles.
MACD
It stands for Moving Average Convergence Divergence (in French: Convergence et Divergence des Moyennes Mobiles) is the difference between two different exponential moving averages (EMA), usually over 26 and 12 time units.
- MACD = EMA26 – EMA12
The MACD curve is associated with a second curve called Signal which is simply the EMA over 9 time units of this MACD.
- Signal = EMA9 of MACD
To make predictions on the market trend, we will look at when the MACD and the Signal intersect.
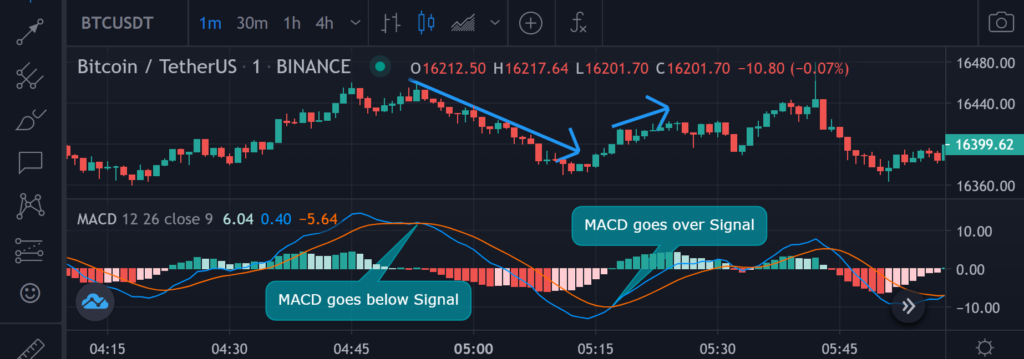
- If the MACD crosses the Signal higher, it is a buy signal.
- If the MACD crosses the Signal lower, it is a sell signal.
Very common in technical trading analysis, it is very reliable in the short term, fairly reliable in the medium term and very unreliable in the long term.
The Stochastic Oscillator
It is an indicator that helps identify overbought and oversold. Very easy to use, it has a value between 0 and 100.
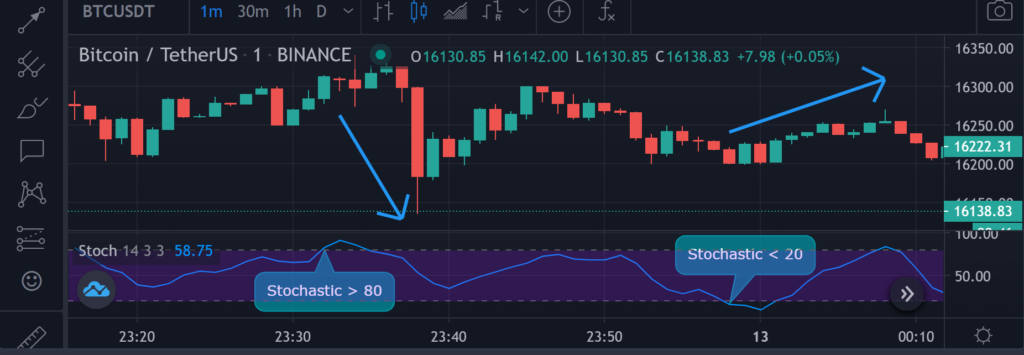
If the Stochastic Oscillator rises above 80, we are in an overbought period. A trend reversal and therefore a bearish movement is possible.
If the Stochastic Oscillator goes below 20, we are in an oversold period. A trend reversal and therefore a bullish movement is possible.
As with all of the best trading indicators, it should not be used alone. If it indicates a trend reversal, check to see if other indicators are showing the same trend.
Ichimoku
Ichimoku is a set of two curves calculated from moving averages. These two curves form a cloud. If the market price is:
- in the cloud, there is no expected trend reversal.
- below the cloud, a bearish movement is coming.
- above the cloud, a bullish movement is coming.
Bollinger Bands
Bollinger bands are made up of three lines.
The main line is a moving average.
The top and bottom lines are calculated starting from the main line and adding or subtracting a standard deviation from the last N prices.
- The further apart the upper and lower bands, the higher the volatility.
- The closer the upper and lower bands, the lower the volatility.
When the market price breaks out of the upper or lower band and then re-enters it, we can expect a trend reversal.
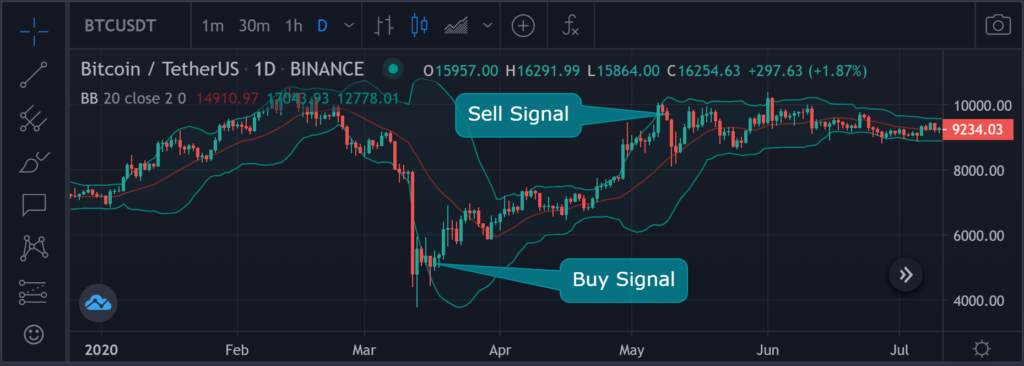
If the market price drops, crosses the lower band, and then crosses that band back up again, this is a buy signal.
If the market price rises, crosses the upper band and then crosses that band back below, this is a sell signal.
Traders particularly like this indicator for their technical trading analysis.
The Pivot Point
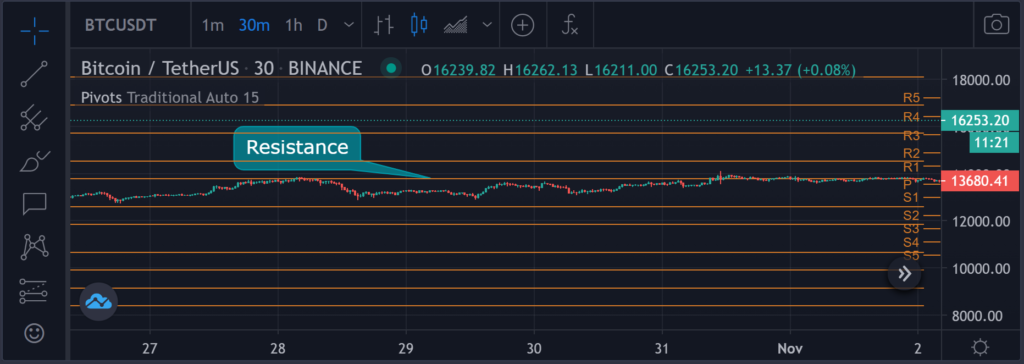
The Pivot Point is used to determine Supports and Resistances on a graph.
It is calculated by averaging the high price, the low price and the closing price of the previous period, which is daily or weekly.
- Pivot Point = (High price + Low price + Close price) / 3
Automatically calculated from the Pivot Point, lines appear which are Support and Resistance levels.
- If the market price is above the Pivot Point, the trend is bullish.
- If the market price is below the Pivot Point, the trend is bearish.
Support and Resistance levels are useful for placing your Take Profit or Stop Loss. Because the price will generally come up against these levels.
If a Resistance is positively exceeded by the market price, then it now acts as Support.
If a Support is positively exceeded by the market price, then it now acts as a Resistance.
Price Action Trading : Waves
Description
The market price will very rarely go up or down in a linear fashion. It consists of bullish and bearish movements that will alternate. These are called waves. A wave is a big price movement. Thanks to waves, we can do Price Action Trading to predict future prices.
- If the ascending waves are more important than the descending waves, we are in a bull market.
- If the descending waves are more important than the ascending waves, we are in a bear market.
We will differentiate the impulsive waves from the corrective waves.
In a bull market, impulse waves are ascending and corrective waves are descending.
In a bear market, impulse waves are descending and corrective waves are ascending.
Use
You have to get into position during corrective waves.
In a bull market, you have to buy on a downward wave, because you are at the bottom of the next upward wave.
In a bear market, you have to sell on an ascending wave, because you are at the top of the next descending wave.
The waves also help identify trend reversals. If a corrective wave is larger than the previous small corrective waves, especially if it is the same size of the impulse waves, the trend can be considered to have reversed.
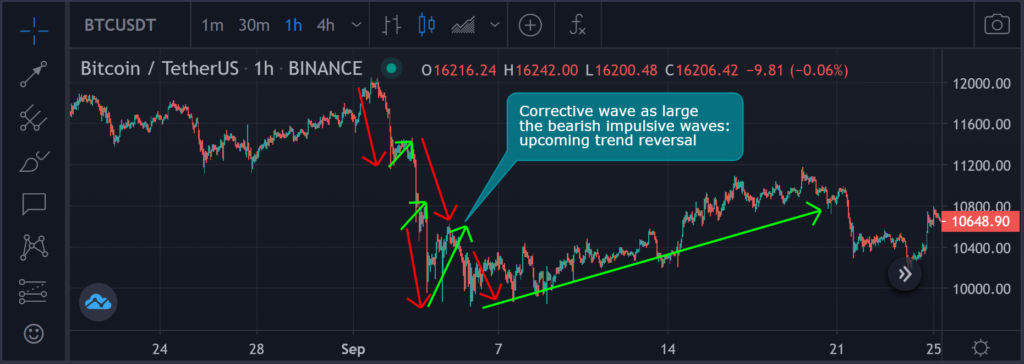
A priori very simple to implement, it takes years of practice to successfully enter and exit a position on these waves.
It is one of the best indicators for technical analysis of trading, if not the best if you master these waves perfectly.
Price Action Trading : Elliott Waves
Ralph Nelson Elliott identified that waves generally behave the same way.
An impulse wave contains 5 waves divided into 3 impulse waves and 2 corrective waves: impulse-correction-impulse-correction-impulse. We denote them (1, 2, 3, 4, 5).
A corrective wave contains 3 waves divided into 2 impulsive waves and 1 corrective wave: impulse-correction-impulse. We denote them (A, B, C).
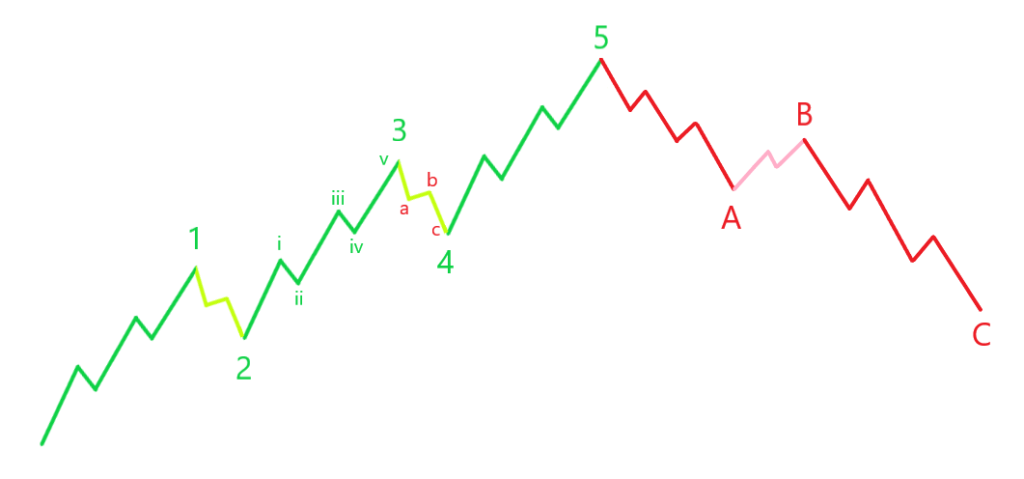
What’s very interesting about these waves is that they are fractal ! Which means :
- each pulse (1, 3, 5, A, C) is itself made up of 5 sub-waves (i, ii, iii, iv, v).
- each correction (2, 4, B) is itself made up of 3 sub-waves (a, b, c).
And these sub-waves are themselves made up of Elliott sub-sub-waves, and so on.
In theory :
- wave 2 is 60% the size of wave 1
- the biggest wave is wave 3
- wave 4 is 30 to 40% of wave 3
Combined with the best trading indicators, Elliott Waves are very powerful for technical analysis and Price Action Trading.
We hope this article will help you become a Good Trader and be a winner in the cryptocurrency market or traditional financial markets.
Share it with others and support us by sharing it on the social network of your choice and sending it to your contacts who may be interested.
To meet the community of English-speaking Crypto Traders, or to ask us for help, join our Telegram group.
For any question, you can ask it in comment.
To continue your trading learning and review the basics, we recommend reading our article on Trading Vocabulary, or on Dollar Cost Averaging, or to read how to become a trader for the copy trading by creating your own copy trading group for your friends/subscribers/community..
Conclusion
In conclusion, technical analysis is a powerful approach to trading, and it relies on a combination of the best TA indicators, such as MACD and RSI, along with price action trading. These indicators play a crucial role in analyzing stock charts and identifying potential entry and exit points for trades.
The MACD (Moving Average Convergence Divergence) is a widely used technical indicator that helps traders spot trend changes and gauge momentum. The RSI (Relative Strength Index) is another essential indicator that measures the speed and change of price movements, indicating overbought or oversold conditions.
When combined with price action analysis, which involves studying the patterns and behavior of price movements, these indicators can provide valuable insights into market trends and potential trading opportunities. Additionally, considering trading volume alongside these indicators is crucial, as it provides information about the strength and validity of price movements.
Whether you are a beginner or an experienced trader, understanding and utilizing the best stock indicators, such as MACD, RSI, and trading volume, can greatly enhance your trading decisions and overall success. It’s essential to practice and gain experience to effectively interpret these indicators in conjunction with price action to make well-informed trading choices based on technical analysis. By integrating these valuable tools into your trading strategy, you can navigate the markets with greater confidence and precision.
This article is not investment advice. Do your own research before investing in the cryptocurrency market.