
First, we will explain how to use a indicator on TradingView. Then how to build a cryptocurrency trading bot from this indicator using our trading tool Wall Of Traders !
If you don’t know what an indicator is or if you want to learn more about it, we advise you to read our article “ Technical Analysis: Indicators, MACD, RSI… And Price Action Trading ”
What is a bot?
An auto trader bot is a configuration that will automatically create a Trade through an API. TradingView is a social trading platform like Bitstamp which combines historical data from different markets and offers unique analytical and trading capabilities. One such feature for traders is the creation of TradingView crypto trading bots which can be easily automated. This way you can for example create an ethereum trading bot.
What is a TradingView bot?
TradingView has his own language (PineScript) which allows traders to create a set of predefined conditions. These TradingView scripts are either standalone indicators or complete strategies that can be applied to any chart, for example grid trading bot.
Thanks to the creation of this script, you will be able to control your trading ideas later and to learn how to write a crypto trading bot. TradingView provides detailed results for this strategy. You can try to create it using a ChatGPT TradingView bot.
What are TradingView Alerts?
It allows to create bot auto trade without programming in PineScript. After creating, reviewing and tweaking TradingView, traders can set alerts on their charts. Alerts notify you when conditions are met and let you know when a script enters or exits a situation. These alerts help traders to execute orders and improve their algorithmic trading results by following a predefined trading system. This way, automated trading strategies become real like with ada trading bot.
Fortunately, thanks to our trading tool Wall Of Traders, it is possible to set up automated trading all this rapidly and merely !
How to use an indicator on TradingView?
Let see a cryptocurrency trading bot tutorial. You can apply indicators like moving averages or strategies not only to price data, but also to other indicators. But not an ai crypto tradingbot. This opens up a world of possibilities for technical analysis and allows you to find new opportunities.
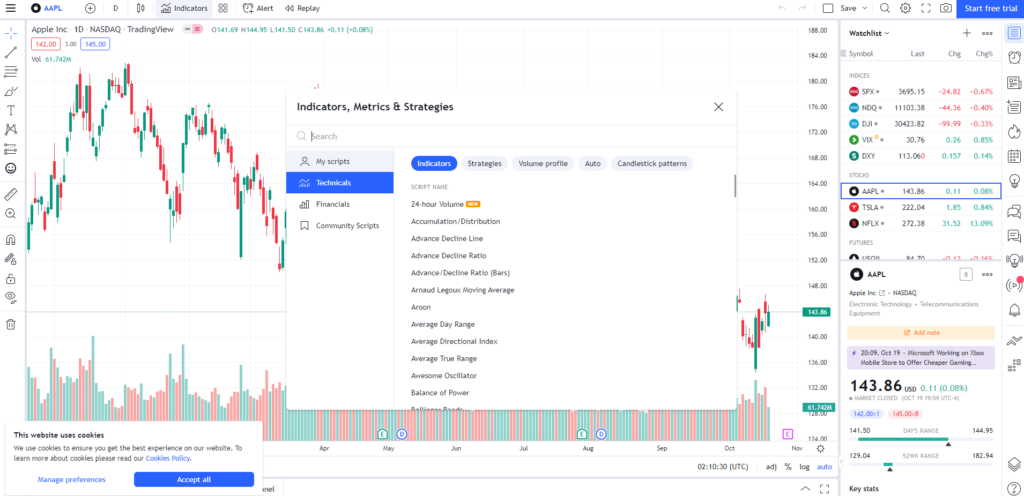
To begin click at the top of the screen on “ Indicators “

Then search for the indicator you want to add to your chart. Then click on it and it will automatically appear on it.
What are the best indicators?
Relative Strength Index (RSI)
The RSI is an indicator of momentum (or oscillator) developed by technical analyst Welles Wilder in 1978. Complex formulas can be used to measure the movement of price movements, the speed and magnitude of these movements, and to assess trading conditions. oversold and of overbought.
The RSI formula ranges from 0 to 100. An asset is considered oversold when it falls below the 30 range. If the value exceeds 70, the chart enters the overbought zone. In some cases, such as during an ongoing trend, the indicator remains in overbought or oversold territory for an extended period of time.
When used on a chart, the indicator ROI is represented by a single line moving horizontally between two parallel lines.
Many traders find it useful to combine the RSI with other indicators. It helps you decide whether you want to stay in the market or exit it. In other cases, this indicator can lead traders to spot market conditions bullish Where bearish, or some exaggerated divergence signals.
Moving Averages (MA), or moving averages
As a lagging indicator, MA is a popular tool used in the Bitcoin and Cryptocurrency markets. Its main purpose is to display the average price of a given number of past candles. In other words, it smooths price movements over a period of time.
Thus, when configuring the indicator of moving average, you can change the number of periods to include. In this context, the period represents a unit of time based on the considered time range of the chart. What MY choose as a trader depends on your trading style?
For example, traders typically use 20, 50, and 200 period ranges. This set of time frames allows traders to identify the general direction of the crypto asset over time based on the selected data set.
A trader’s approach is largely determined by the timeframe they choose. For example, day traders often find a 20-period moving average useful because of the short duration. On the other hand, a 200-period moving average is best suited for long-term traders who can patiently follow trends. Moving averages are always useful in providing traders with a good indication of levels of support and of resistance like with dollar cost averaging.
Bollinger Bands (BB)
The central idea behind the bollinger bands is to highlight how much the price of a cryptocurrency spreads around its average value. The BB is defined by a series of trend lines showing two standard deviations (negative and positive) as price moves away from the simple moving average (SMA). Both bands can be used to determine levels of support and of resistance.
How to create his own crypto Trading Bot from an Indicator on Wall Of Traders?
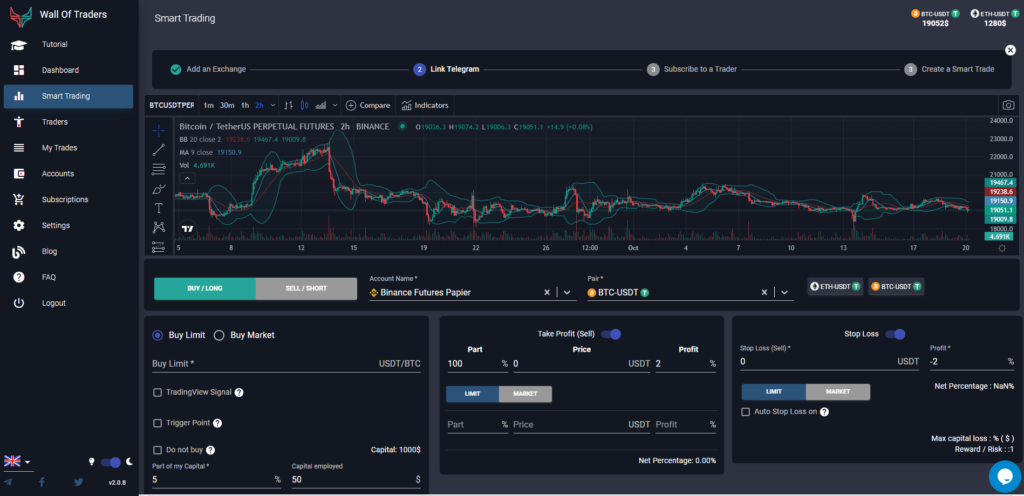
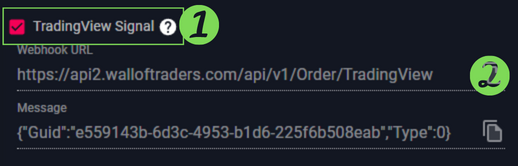
How to automate TradingView strategy? Let’s link a TradingView alert to Binance using Wall Of Traders in order to apply trading strategies. We will create a Bot auto trade Binance. To get started, you have to go to Wall Of Traders, then click on Smart Trading and then on TradingView Signal.
Then copy the Webhook URL, along with the message.
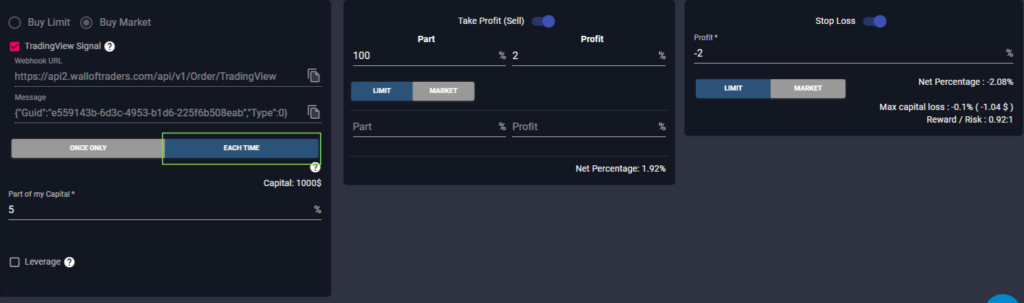
Now create your trade (Take Profit, Stop Loss). Don’t forget to click each time, which will allow you to create a bot and not just an alert.
Then go to TradingView, click on “ Product “, then “ Chart +”

These are the basic steps you will need to perform for any indicator. I invite you to continue reading according to the indicator to which you want to add a bot. Trading concepts can use several indicators.
Note that the methods do not vary greatly from one indicator to another, if you do not find your indicator in this article, simply follow the progress of another, you should find your way there. Finally, you can still look for Tradingview tutorials. Building crypto trading bot like cardano trading bot is exciting but can be hard.
Create a Trading Bot from RSI
How to setup a trading bot? You can then directly add a indicator to your chart such as the RSI. This is your job to find the best crypto bot settings.
The first method is to right-click the RSI curve, then click “ add an RSI alert “.
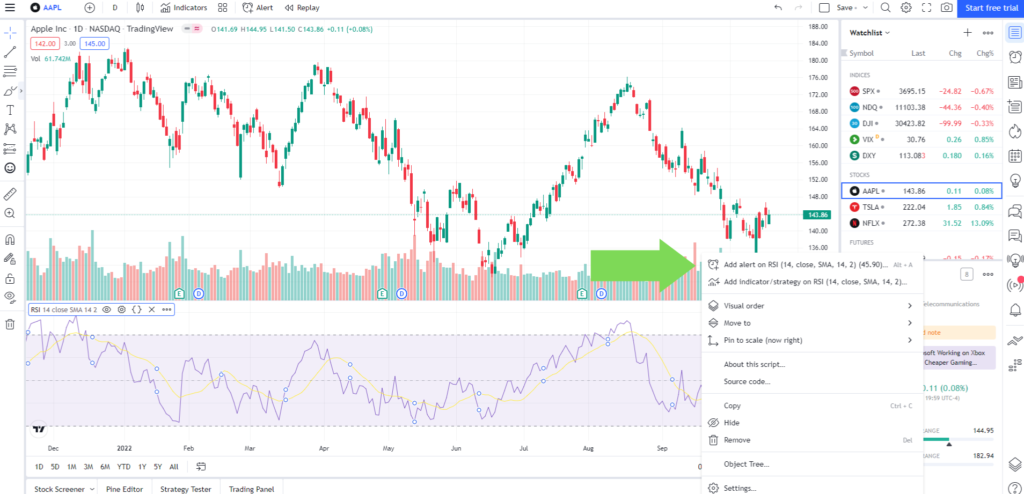
This will open a pop-up where you can define your trading strategy.
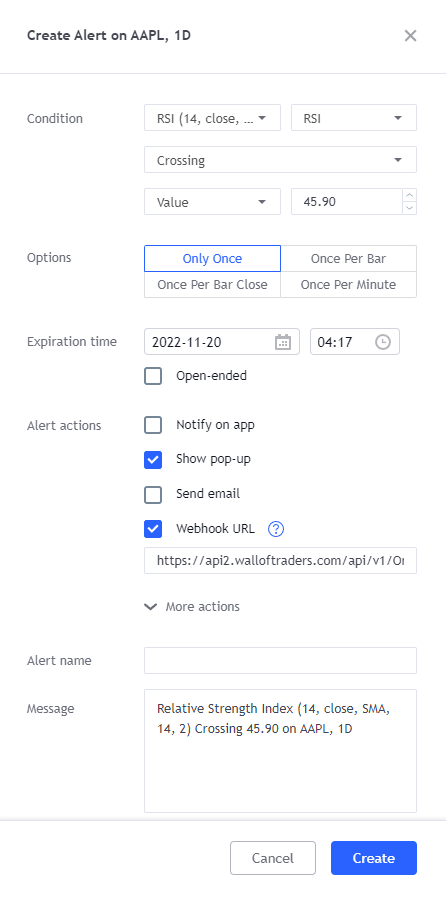
But you can also directly click “ Alert “, at the top of your screen which will also open you this pop up. You can choose what type of alert and therefore bot you want to create.

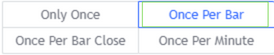
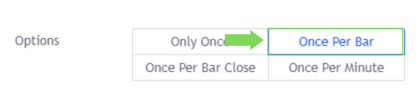
Below, you will find 4 options, do not check “ Once only “, as this will only create a alert and not a bot. I advise you “ Once per bar “.
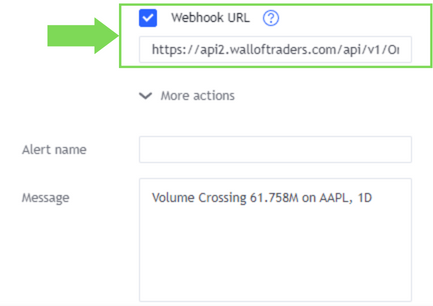
Finally, click “ Webhook URL ” and paste the data previously copied to Wall Of Traders in Webhook URL.
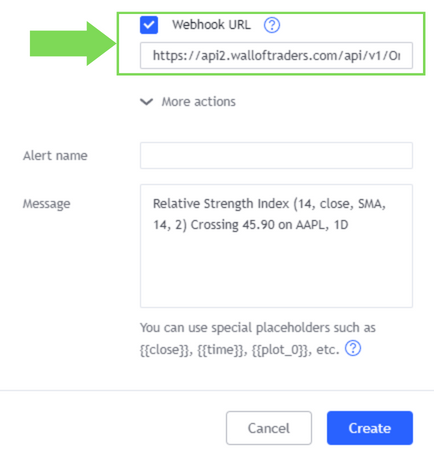
Finally, go to Wall Of Traders, in “ My Trades “, then “ Bot TradingView ” where you will find your bot!
Create a Trading Bot from Volume
Add an indicator to your chart such as Volume.
Right-click the Volume curve, then click “ add flight alert “.
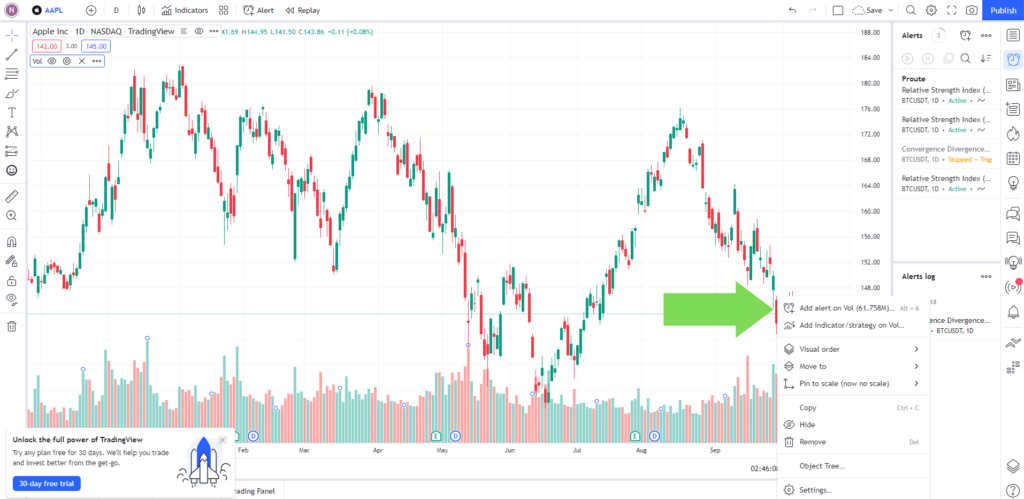
This will open a pop-up where you can define your strategy.
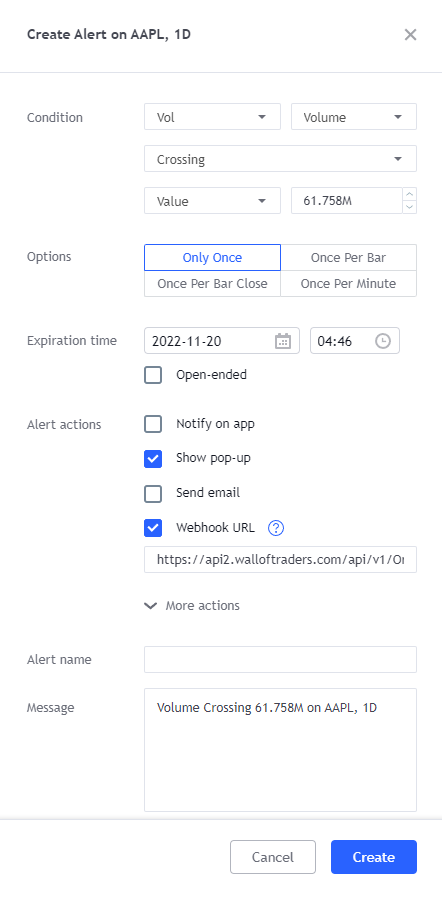
Below, you will find 4 options, do not check “ Once only “, as this will only create an alert and not a Bot. I advise you “ Once per bar “.
Finally, click “ Webhook URL ” and paste the data previously copied to Wall Of Traders in Webhook URL.
Finally, go to Wall Of Traders, in “ My Trades “, then “ Bot TradingView ” where you will find your bot!
Create a Trading Bot from Ichimoku
Let’s create an automated Ichimoku trading robot. Add an indicator to your chart such as Ichimoku.
Right-click the curve of The ichimoku, then click “add an alert on Ichimoku“.
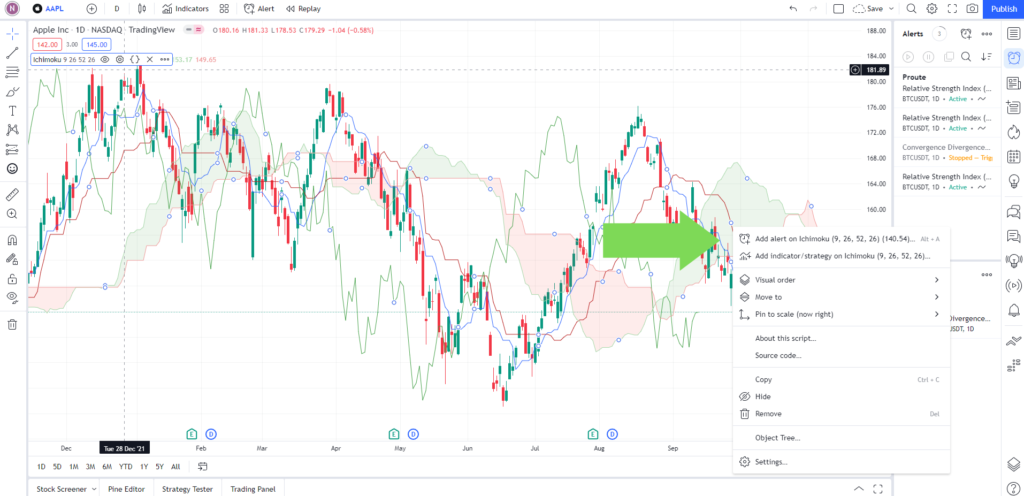
This will open a pop up where you can set your strategy.
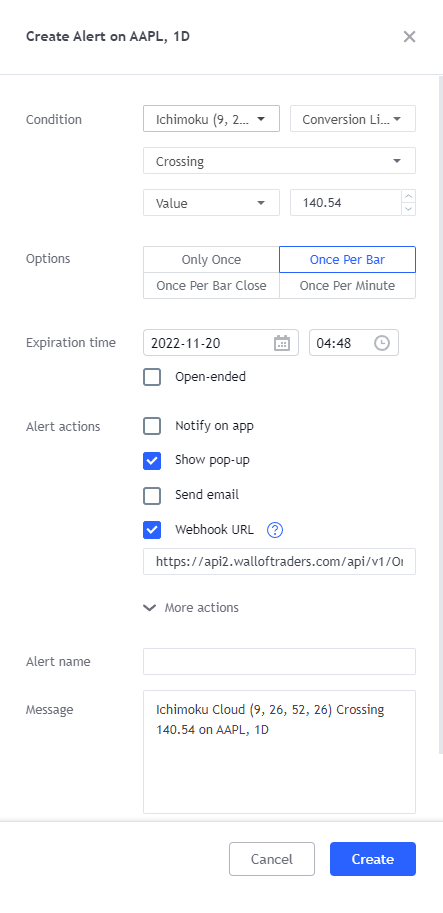
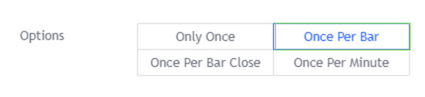
Below, you will find 4 options, do not check “ Once only “, as this will only create a alert and not a bot. I advise you “ Once per bar “.
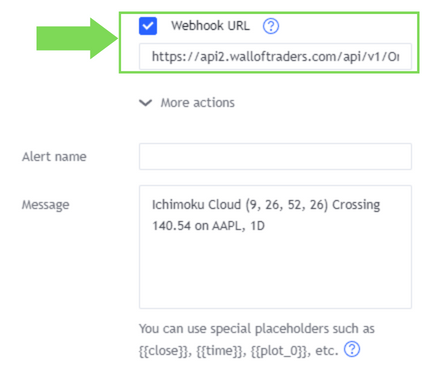
Click on “ Webhook URL ” and paste the data previously copied to Wall Of Traders in Webhook URL and Message.
Finally, go to Wall Of Traders, in “ My Trades “, then “ Bot TradingView ” where you will find your bot!
Conclusion
In conclusion, TradingView offers a powerful platform for traders to create automatic trading bots and enhance their trading strategies using indicators and PineScript scripts. Traders can build advanced trading bots with popular indicators like RSI, MA, and BB, and even explore specific markets like polkadot or crypto trading bots.
By leveraging TradingView’s comprehensive range of indicators and customizable scripts, traders can make a crypto trading bot tailored to their preferences and strategies. Additionally, TradingView alerts play a crucial role in automated trading, allowing for seamless execution of trades when specific conditions are met, including those generated from automated trading with trendlines.
The integration of Wall Of Traders enables traders to connect all their exchange accounts into a single platform, streamlining the process of automated buy and sell actions in the dynamic and fast-paced crypto market.
TradingView empowers traders to develop and implement advanced trading bots, including leveraged grid bots, using its platform, which caters to various financial markets. Traders can optimize their strategies, achieving enhanced efficiency with the help of TradingView’s comprehensive range of indicators, alerts, and customizable scripts.
Whether interested in automated crypto trading or exploring the capabilities of automated trading platforms, TradingView provides the necessary tools and features for traders. Utilizing TradingView’s platform, traders can create, backtest, and deploy cryptocurrency trading bots, benefiting from buy and sell signals, while customizing their strategies according to various pine script time frames.
For those well-versed in tradingview coding and open source trading bot development, TradingView offers ample opportunities to create and implement advanced trading strategies, including sell signals and buy and sell indicators. This facilitates a seamless trading experience, empowering traders to adapt and thrive in the ever-changing financial markets.
I hope you enjoyed this article about automated cryptocurrency grid trading bots and it was helpful to you. This way, you will be able to create the best crypto automated trading bot possible! Even a Dogecoin trading bot for example!
Feel free to check out our other articles, I’m sure they will be very helpful to you!
This article is not investment advice. Do your own research before investing in the cryptocurrency market.